Table of Contents
Introduction: Why True Financial Health Metrics Run Deeper
In the high-stakes world of business, organizations often measure success through familiar financial metrics—revenue growth, profit margins, and market share. These figures regularly populate quarterly reports and executive dashboards, creating an illusion of comprehensive financial insight. Yet these surface-level indicators only tell part of the story, much like judging an iceberg solely by what appears above water.
True financial health runs deeper, revealing itself through less discussed but profoundly important financial health metrics that speak to an organization’s operational efficiency, sustainability, and resilience. These hidden indicators offer early warnings of potential challenges and illuminate paths to sustainable growth that standard metrics might miss entirely.
Finance functions as one of the critical pillars supporting organizational success. As Peter Drucker once noted, “If you can’t measure it, you can’t improve it.” The financial health metrics we’ll explore serve as sophisticated measurement tools that enable finance teams to provide strategic guidance rather than merely reporting historical performance.
What makes these lesser-known financial health metrics particularly valuable is their interconnectedness with other business functions. They influence and are influenced by corporate strategy, creating a feedback loop that shapes long-term planning. Marketing decisions around customer acquisition become more informed when viewed through the lens of customer acquisition cost payback periods. Human resources gains clarity on workforce productivity through revenue per employee analysis. Sales teams benefit from understanding cash conversion cycles when negotiating payment terms. Operations departments find guidance in efficiency metrics that highlight process improvement opportunities.
The most successful organizations recognize finance not as an isolated department but as an integrative force that provides decisive insights across functions. By monitoring these deeper financial health metrics, leadership teams gain a comprehensive understanding of organizational vitality that transcends traditional accounting measures.
| Business Function | How Financial Health Metrics Inform Decision-Making |
|---|---|
| Corporate Strategy | Provides data for long-term planning and resource allocation decisions |
| Marketing | Guides customer acquisition spending and retention programs |
| Human Resources | Informs hiring decisions and productivity improvement initiatives |
| Sales | Shapes pricing strategies and payment term negotiations |
| Operations | Highlights efficiency opportunities and process improvements |
| Risk Management | Identifies potential vulnerabilities before they appear in traditional financial health metrics |
| Innovation | Determines financial feasibility of new initiatives and projects |
As we explore these six critical but often overlooked financial health metrics, consider how they might reshape your understanding of your organization’s true financial condition. These metrics offer a more nuanced view that can transform financial management from a reporting function to a strategic advantage.
Financial Health Metric 1: Cash Conversion Cycle: The Quiet Efficiency Indicator
The Cash Conversion Cycle (CCC) remains one of the most revealing yet underutilized metrics in financial analysis. This powerful indicator measures the time required for a company to convert investments in inventory and other resources into cash flows from sales. Unlike flashier metrics that grab headlines, CCC quietly reveals operational efficiency and management effectiveness.
The fundamental calculation of the CCC is based on a straightforward formula: Days Inventory Outstanding (DIO) plus Days Sales Outstanding (DSO) minus Days Payable Outstanding (DPO). This formula provides a detailed perspective on the effectiveness with which a company oversees its working capital during its operational activities.
A shorter cash conversion cycle signals exceptional operational health. It indicates that a company quickly turns inventory into sales, promptly collects payment from customers, and strategically manages payments to suppliers. Companies with negative CCCs—those that receive payment from customers before paying suppliers—have essentially unlocked interest-free financing for their operations.
Consider how Amazon transformed retail by optimizing its cash conversion cycle. By 2020, Amazon operated with a negative CCC of approximately -30 days, meaning it received payment from customers nearly a month before paying its suppliers. This advantage provided billions in essentially interest-free operating capital, funding extraordinary growth while competitors struggled with traditional financing.
The CCC provides particular value during economic uncertainty. When credit markets tighten, companies with efficient cash conversion cycles enjoy greater financial flexibility than competitors with longer cycles. They can weather downturns without desperate cost-cutting measures that might damage long-term capabilities.
For investors and analysts, tracking CCC trends over time reveals more than static financial statements. A consistently improving CCC suggests management effectiveness and operational discipline that will likely create value over time. Conversely, a deteriorating cycle may serve as an early warning system for underlying problems, even when revenue and profit figures still appear healthy.
| Industry | Typical Cash Conversion Cycle | Why It Matters |
|---|---|---|
| Retail (Brick & Mortar) | 30-40 days | Inventory management efficiency crucial for thin margins |
| Technology Manufacturing | 50-60 days | Component sourcing and production timing critical |
| Pharmaceutical | 100+ days | Long R&D and production cycles create working capital challenges |
| Grocery | -5 to 10 days | Rapid inventory turnover with supplier credit terms creates working capital advantage |
| E-commerce | -15 to 20 days | Online payment processing creates negative cycle opportunity |
Finance teams should monitor CCC alongside traditional liquidity measures. While financial health metrics like the current ratio provide a snapshot of liquidity at a specific moment, the cash conversion cycle reveals the dynamic flow of working capital through operations. This flow perspective often provides earlier signals of emerging challenges or improvements.
The CCC also helps companies identify specific operational areas for improvement. A company might have acceptable overall CCC numbers but discover opportunities by analyzing individual components. Perhaps inventory management needs refinement, collection processes could be more efficient, or supplier payment terms might be renegotiated.
By understanding and optimizing their cash conversion cycle, organizations unlock hidden liquidity power that creates a competitive advantage through greater financial agility and reduced reliance on external financing.
Financial Health Metric 2: Burn Multiple: The Real Test of Startups and Scale-Ups
In the high-stakes world of startups and scale-ups, the burn multiple has emerged as a critical financial health metric that reveals the true efficiency of growth investments. While venture capitalists and founders often focus on growth rates and cash runway, the burn multiple provides a more sophisticated lens through which to evaluate sustainability and capital efficiency.
The burn multiple measures how efficiently a company converts cash burn into revenue growth. Calculated by dividing net burn by net new annual recurring revenue (ARR), this financial health metric reveals whether a company is achieving efficient growth or merely buying revenue at unsustainable costs. A burn multiple of 1.0 indicates a company burns one dollar to add one dollar of ARR—generally considered the upper threshold of efficiency for high-growth companies.
David Sacks, the founder of Craft Ventures, brought attention to this metric by stating, “the burn multiple addresses the question: how much are you spending to produce each additional dollar of ARR?” This perspective shifts the focus from pursuing growth indiscriminately to achieving growth with a sensible level of efficiency.
For founders navigating fundraising environments, understanding burn multiple provides strategic clarity. During abundant funding periods, companies with higher burn multiples might still secure financing based on growth rates alone. However, during market corrections or downturns, this financial health metric becomes a dividing line between companies that survive and those forced into difficult down rounds or worse.
The beauty of the burn multiple lies in its resistance to manipulation. While companies might temporarily boost growth through unsustainable marketing spend or aggressive discounting, these tactics inevitably worsen the burn multiple, exposing inefficient growth models. This transparency helps boards and investors identify problems earlier than traditional metrics might reveal.
| Burn Multiple Range | What It Indicates | Typical Funding Environment Response |
|---|---|---|
| Less than 1.0 | Highly efficient growth | Attractive in any funding environment |
| 1.0 – 1.5 | Good efficiency | Very fundable in normal markets |
| 1.5 – 2.0 | Moderate efficiency | Requires strong growth to offset in normal markets |
| 2.0 – 3.0 | Questionable efficiency | Challenging except in very frothy markets |
| Greater than 3.0 | Poor efficiency | Typically unfundable without strategic value |
Industry analyst Tom Tunguz of Redpoint Ventures found that public SaaS companies averaged burn multiples between 1.0 and 1.5 during their growth phases. This benchmark helps private companies understand where they stand relative to companies that successfully navigated the path to public markets.
The burn multiple also encourages operational discipline by forcing companies to analyze which growth investments generate the most efficient returns. Marketing channels, sales approaches, and product investments all reveal their true efficiency when viewed through this financial health metric. This analysis often leads to counterintuitive decisions, such as reducing spending in high-growth but inefficient channels in favor of slower but more capital-efficient approaches.
For companies facing difficult market conditions, improving burn multiple becomes a powerful survival strategy. By focusing relentlessly on this metric, management teams identify inefficiencies that might otherwise remain hidden behind impressive growth numbers. This clarity enables more strategic decisions about where to invest limited capital for maximum impact.
As funding environments continue to evolve, the burn multiple will likely become an even more central financial metric in evaluating startup and scale-up financial health, helping separate truly sustainable growth stories from those built on foundations of inefficient capital deployment.
Financial Health Metric 3: Revenue per Employee: The Human Capital Lens
Revenue per employee offers a surprisingly revealing window into organizational productivity and operational efficiency. This deceptively simple financial health metric—calculated by dividing total revenue by employee count—provides insights that extend far beyond human resources concerns into core questions of business model efficiency and scalability.
Unlike profit-focused financial health metrics that can be influenced by accounting choices, revenue per employee offers a clearer view of how effectively an organization converts human capital into market value. It serves as a fundamental measure of productivity that transcends industry and company size, enabling meaningful comparisons across different business models and growth stages.
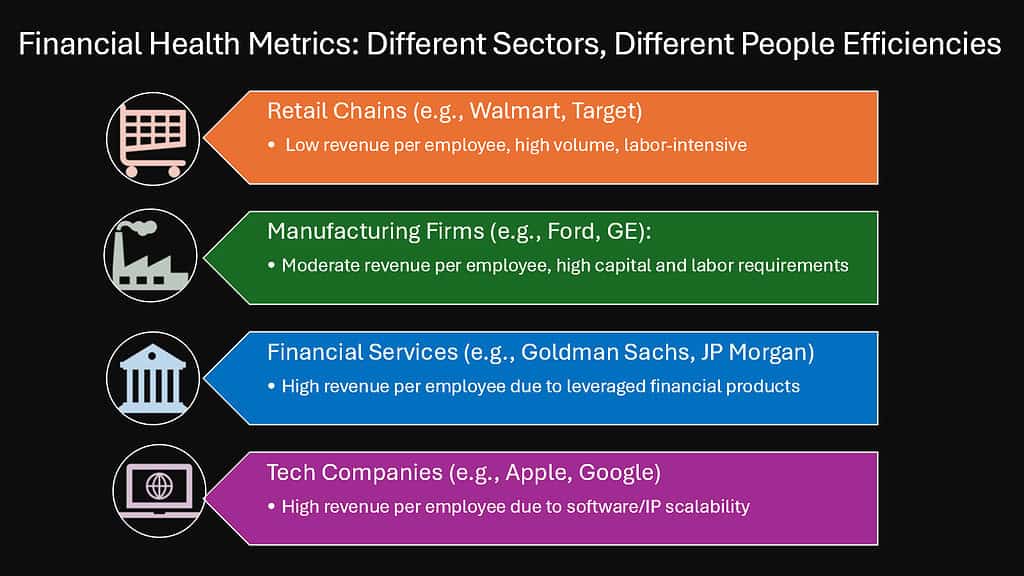
This financial health metric exhibits significant variation across different industries, highlighting the fundamental distinctions in their business models. For instance, technology firms such as Apple and Google often report figures that exceed $1 million per employee, whereas labor-intensive service industries typically yield between $100,000 and $300,000 per employee. These variations do not signify success or failure; instead, they illustrate the differing levels of capital intensity and leverage that characterize various business models.
What makes revenue per employee particularly valuable is tracking its trajectory over time. Growing companies should aim for increases in this financial health metric as they scale, indicating improving operational efficiency rather than merely adding headcount proportional to revenue growth. The most successful organizations demonstrate “super-linear scaling”—the ability to grow revenue faster than employee count, creating increasing returns to scale.
For leadership teams, revenue per employee highlights potential structural advantages or challenges in business models. It prompts important strategic questions: Could automation improve this financial health metric? Are there opportunities for greater leverage through technology? Does our organizational design optimize productivity?
| Industry | Typical Revenue per Employee Range | Strategic Implications |
|---|---|---|
| Software/SaaS | $300,000 – $700,000 | Higher figures indicate effective product-led growth |
| Professional Services | $100,000 – $300,000 | Limited scalability requires premium pricing strategy |
| Manufacturing | $200,000 – $500,000 | Capital investment and automation drive improvements |
| Retail | $150,000 – $350,000 | E-commerce integration typically improves this financial health metric |
| Financial Services | $250,000 – $750,000 | Technology leverage creates wide variation within sector |
| Healthcare | $150,000 – $400,000 | Regulatory requirements create productivity ceilings |
Research by McKinsey’s Global Institute found that companies in the top quartile of revenue per employee within their sectors delivered shareholder returns approximately 65% higher than industry peers over a five-year period. This correlation highlights how operational efficiency translates into market performance over time.
The metric proves particularly valuable during economic uncertainty or downturns. Organizations with higher revenue per employee typically have greater flexibility to weather challenging conditions without dramatic workforce reductions. This resilience stems from having fewer fixed costs relative to revenue generation capacity.
Revenue per employee also serves as an effective benchmark when evaluating potential acquisitions. Companies with significantly lower figures than industry peers may represent turnaround opportunities through improved operational practices, while those with substantially higher metrics might justify premium valuations.
For growing organizations, this financial health metric helps prevent the common pitfall of solving problems by simply adding headcount. By maintaining focus on revenue per employee, leadership teams ensure that growth investments translate into greater organizational leverage rather than merely expanding the organizational chart.
As automation and artificial intelligence continue transforming work across industries, revenue per employee will likely become an even more critical indicator of organizational health and competitive advantage in an increasingly technology-driven business landscape.
Financial Health Metric 4: Operating Cash Flow Ratio: The Liquidity Reality Check
While accounting profits capture headlines and analyst attention, the operating cash flow ratio provides a more grounded perspective on a company’s true financial position. This often-overlooked financial health metric cuts through accounting treatments to reveal a company’s fundamental ability to cover short-term obligations from its operations—a crucial indicator of financial stability.
The operating cash flow ratio, calculated by dividing operating cash flow by current liabilities, measures how effectively a company’s core business activities generate sufficient cash to meet short-term financial obligations. Unlike profit figures that include non-cash items and accounting estimates, this ratio focuses exclusively on actual cash generated from operations.
This distinction becomes particularly important during economic stress periods. Companies with strong earnings but weak operating cash flow ratios may face liquidity challenges despite appearing profitable on paper. Conversely, businesses with modest profits but robust operating cash flows often demonstrate greater resilience during downturns.
Examine the differing cases of Enron and Walmart during the early 2000s. Enron showcased remarkable profits, yet its operating cash flow ratio declined—a red flag that was largely ignored until it was too late. In contrast, Walmart sustained a stable operating cash flow ratio exceeding 0.4, reflecting authentic financial robustness that surpassed the variations in quarterly earnings.
The metric provides especially valuable insights in industries with significant differences between accounting recognition and cash collection. Software companies transitioning to subscription models, construction firms with long project timelines, and manufacturers with complex supply chains all benefit from focusing on this ratio alongside traditional profitability measures.
| Operating Cash Flow Ratio | Financial Health Metrics | Strategic Implications |
|---|---|---|
| Greater than 1.0 | Excellent liquidity | Potential for debt reduction or strategic investments |
| 0.6 – 1.0 | Strong position | Comfortable operational flexibility |
| 0.4 – 0.6 | Adequate | Manageable but requires attention |
| 0.2 – 0.4 | Potential concern | May need working capital improvements |
| Less than 0.2 | Significant risk | Immediate cash management attention required |
A study by the Financial Analysts Journal found that companies in the top quartile of operating cash flow ratios within their industries were 60% less likely to experience financial distress during economic downturns compared to bottom-quartile peers. This protective quality makes the metric particularly valuable for risk assessment.
For management teams, tracking this ratio over time provides earlier warning signals than many traditional financial health metrics. A declining trend, even while still in positive territory, often indicates emerging operational challenges or deteriorating market conditions that warrant investigation before they impact more visible metrics.
The operating cash flow ratio also offers insights when evaluating capital allocation decisions. Companies with consistently strong ratios can more confidently pursue growth investments, strategic acquisitions, or shareholder returns. Those with weaker or volatile ratios might prioritize strengthening their operational cash generation before major initiatives.
Investors increasingly recognize the value of this financial health metric, particularly following periods of market turbulence that exposed the limitations of earnings-based analysis. Warren Buffett has long emphasized cash generation over reported earnings, noting that “accounting is the language of business, but cash is the oxygen.”
By incorporating the operating cash flow ratio into regular financial analysis, organizations gain a clearer understanding of their true liquidity position. This understanding enables more informed decisions about everything from day-to-day operations to long-term strategic initiatives, creating a more resilient financial foundation.
Financial Health Metric 5: Customer Acquisition Cost Payback Period: The Patience Signal
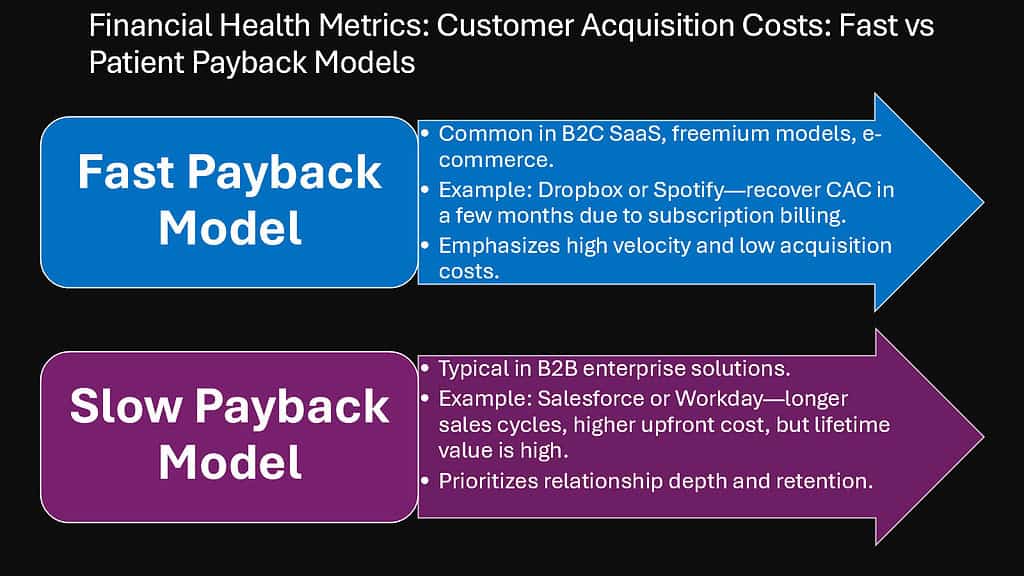
In an era of growth-at-all-costs thinking, the customer acquisition cost (CAC) payback period brings much-needed perspective to marketing efficiency and sustainable growth. This financial health metric measures how long it takes a company to recover the cost of acquiring a new customer through the gross margin generated by that customer—providing crucial insights into business model viability and marketing effectiveness.
Unlike simpler financial health metrics that focus solely on acquisition costs or lifetime value in isolation, the CAC payback period connects these concepts into a time-based measure that reveals the capital efficiency of customer acquisition strategies. A company might tolerate high acquisition costs if the payback period remains reasonable, while seemingly modest acquisition costs might prove problematic if recovery takes too long.
The calculation follows a straightforward approach: divide the customer acquisition cost by the monthly gross margin per customer. The result shows how many months it takes to recover the initial investment in acquiring that customer. While specific benchmarks vary by industry and business model, SaaS companies typically target 12-18 month payback periods, while e-commerce businesses often aim for 3-6 months.
This financial health metric proves particularly valuable for subscription-based businesses where initial acquisition costs must be recovered over time. During the subscription economy boom, many companies pursued growth with insufficient attention to payback periods, leading to unsustainable models that collapsed when funding environments tightened. Those that maintained discipline around this metric typically weathered changing market conditions more effectively.
The CAC payback period also provides important signals about pricing strategy, customer services, and customer retention efforts. A lengthening payback period might indicate pricing pressure in the market, inefficient marketing spend, or declining customer lifetime value—each requiring different strategic responses.
| Industry | Typical CAC Payback Period | Strategic Implications |
|---|---|---|
| Enterprise SaaS | 18-24 months | Longer sales cycles require patient capital |
| Consumer Subscription | 6-12 months | Churn rates critically impact sustainability |
| E-commerce | 3-6 months | Repeat purchase behavior determines viability |
| Financial Services | 12-36 months | High acquisition costs require excellent retention |
| Healthcare | 12-24 months | Regulatory costs influence acquisition efficiency |
| Mobile Applications | 4-10 months | Platform fees impact margin recovery timeline |
Analysis by First Round Capital found that companies with CAC payback periods under 12 months were 4.4 times more likely to achieve sustainable unit economics than those with longer payback periods. This dramatic difference highlights how this financial health metric connects directly to business model viability.
For marketing leaders, understanding this metric transforms budget discussions from cost centers to investment decisions with clear return horizons. It encourages balanced thinking between growth velocity and efficiency, preventing the common pitfall of pursuing headline growth numbers at the expense of sustainable economics.
This financial health metric also informs product development priorities. Features that either reduce acquisition costs or increase early-stage customer value can dramatically improve CAC payback periods, creating compounding benefits for the business. This perspective often identifies higher-impact development priorities than features that merely address surface-level customer requests.
During economic uncertainty, companies with shorter CAC payback periods gain strategic flexibility. They can reduce marketing spend without endangering financial stability if needed, or potentially accelerate growth by reinvesting recovered capital while competitors retreat from the market.
By incorporating CAC payback period analysis into regular marketing and financial reviews, organizations develop greater discipline around customer acquisition investments. This discipline typically leads to more sustainable growth trajectories and business models capable of thriving across different market environments.
Financial Health Metric 6: Interest Coverage Ratio: The Debt Breathing Room
In a business landscape increasingly shaped by debt financing, the interest coverage ratio provides critical insight into a company’s financial flexibility and risk profile. This underappreciated financial health metric measures how comfortably a company can meet interest obligations from its operating earnings, offering a clear window into debt sustainability that many standard analyses overlook.
Calculated by dividing earnings before interest and taxes (EBIT) by interest expenses, the interest coverage ratio indicates how many times over a company could pay its interest obligations from current earnings. While seemingly straightforward, this financial health metric reveals nuanced insights about financial resilience that more commonly cited debt metrics might miss.
Unlike the debt-to-equity ratio, which focuses on balance sheet structure, the interest coverage ratio captures the dynamic relationship between operational performance and debt service requirements. A company might carry substantial debt yet maintain a healthy interest coverage ratio through strong earnings, while another with modest debt but weak earnings could face greater financial strain despite appearing less leveraged on paper.
This distinction becomes particularly important during interest rate volatility. Companies with strong interest coverage ratios typically weather rising rate environments more effectively, as their earnings provide substantial cushion above minimum debt service requirements. Those with ratios closer to 1.0 face increasing pressure as rates climb, often forcing operational constraints that further compromise performance.
The metric has gained renewed relevance as corporate debt levels reached historic highs following extended periods of low interest rates. Analysis by S&P Global found that nearly 20% of U.S. public companies maintained interest coverage ratios below 2.0 in recent years—a potential vulnerability should economic conditions deteriorate or interest rates rise significantly.
| Interest Coverage Ratio | Risk Level | Typical Credit Rating Impact |
|---|---|---|
| Greater than 5.0 | Minimal debt service risk | Positive factor in credit assessment |
| 3.0 – 5.0 | Low risk | Neutral to positive influence |
| 2.0 – 3.0 | Moderate risk | Closer monitoring warranted |
| 1.5 – 2.0 | Elevated risk | Potential constraint on ratings |
| 1.0 – 1.5 | High risk | Negative factor in assessments |
| Less than 1.0 | Severe risk | Potential for financial distress |
For financial leaders, tracking this ratio provides early warning of emerging challenges. A declining trend, even while maintaining seemingly comfortable absolute levels, often signals developing problems that deserve investigation. This early detection capacity makes this financial health metric valuable for proactive financial management.
The interest coverage ratio also influences strategic flexibility. Companies with stronger ratios typically enjoy greater latitude in capital allocation decisions, from pursuing growth investments to returning capital to shareholders. Those with weaker coverage find their options increasingly constrained by debt service requirements, potentially limiting competitive responses or growth opportunities.
Investors increasingly recognize the importance of this financial health metric, following several high-profile cases where companies maintained investment-grade ratings despite deteriorating interest coverage. Howard Marks of Oaktree Capital has noted that “focusing on leverage ratios without understanding interest coverage provides incomplete risk assessment, particularly during transitional interest rate environments.”
For companies considering new debt issuance or refinancing, understanding their interest coverage position relative to industry peers and historical trends provides crucial context. A strong ratio might justify more aggressive capital structure optimization, while a weaker position suggests greater conservatism despite potential tax or leverage benefits.
By incorporating interest coverage ratio analysis into regular financial reviews, organizations develop more nuanced understanding of their debt capacity and financial resilience. This understanding enables more informed capital structure decisions and better preparation for changing interest rate environments.
Conclusion: Rethinking Financial Health Metrics: Things That Truly Matter
Financial health, much like physical health, reveals itself not through a single measurement but through a constellation of financial metrics and indicators that together create a comprehensive picture. The six metrics explored in this article—cash conversion cycle, burn multiple, revenue per employee, operating cash flow ratio, customer acquisition cost payback period, and interest coverage ratio—provide this more nuanced view, capturing dimensions of financial vitality that traditional metrics often miss.
These financial health indicators share important characteristics that make them particularly valuable for forward-looking financial management. They focus on operational reality rather than accounting treatments. They connect different aspects of the business into integrated insights. They provide earlier warning signals than more commonly cited metrics. And they reveal financial resilience that might remain hidden in standard analyses.
What makes these financial health metrics powerful is not just their individual insights but how they work together to illuminate different facets of financial health. A company might maintain a strong cash conversion cycle while its interest coverage deteriorates, or show excellent revenue per employee while burn multiple increases to concerning levels. Only by monitoring the full constellation can leaders develop comprehensive understanding of their true financial position.
For financial leaders, these metrics offer a path toward more strategic organizational influence. Rather than simply reporting historical performance, finance teams using these indicators provide forward-looking insights that shape strategic decisions across functions. This elevated role transforms finance from scorekeeper to strategic partner in organizational success.
| Key Benefit | How These Metrics Deliver |
|---|---|
| Earlier Warning Signals | Identify potential issues before they appear in traditional metrics |
| Operational Focus | Connect financial results to specific operational drivers |
| Cross-Functional Relevance | Provide insights meaningful across departmental boundaries |
| Future Orientation | Indicate sustainability and resilience rather than just historical performance |
| Strategic Context | Frame financial results within broader business strategy |
| Investor Communication | Offer more sophisticated narrative about financial health |
| Competitive Benchmarking | Enable meaningful comparison across different business models |
The economic uncertainty that has characterized recent years makes these deeper financial health metrics more valuable than ever. Organizations that understand and monitor these indicators develop greater resilience against unexpected challenges and more quickly identify emerging opportunities. This advantage compounds over time as better-informed decisions create increasingly favorable financial positions.
As you evaluate your organization’s financial measurement strategy, consider whether it encompasses these more profound aspects of financial well-being. Are you tracking metrics that offer early alerts instead of merely reflecting past performance? Do your financial indicators correlate directly with operational factors that teams can impact? Does your analysis uncover resilience and sustainability that extend beyond present performance?
True financial health remains quiet, steady, and often invisible at first glance. It builds gradually through disciplined operational execution and thoughtful strategic choices rather than financial engineering or short-term optimization. The metrics explored here provide visibility into this quieter, deeper financial health—the kind that sustains organizations through challenges and positions them for long-term success.
By incorporating these often-overlooked financial health metrics into your financial analysis framework, you develop a more comprehensive understanding of organizational vitality that transcends traditional accounting measures. This understanding creates the foundation for more informed decisions, greater operational resilience, and sustainable competitive advantage in an increasingly complex business environment.


